Your PV plant does not need another dashboard. It needs answers.
Solar Spy connects KPIs, diagnostics, the Digital Twin, and SolAI to identify what is reducing performance, quantify its impact, and show where your team needs to act.
Most platforms show data. Few tell you what to do next.
Data without context is just visibility. Without linking it to KPIs and diagnostics, you can't effectively pinpoint losses or drive consistent decisions across the portfolio.
No clear explanation of what is driving underperformance
Impact assessment still requires manual interpretation
Data scattered across tools and reports
Operations teams lack consistent priorities
How does it work?
How Solar Spy turns data into decisions ?
One system that connects KPIs, the plant model, AI analysis, and operational logic.
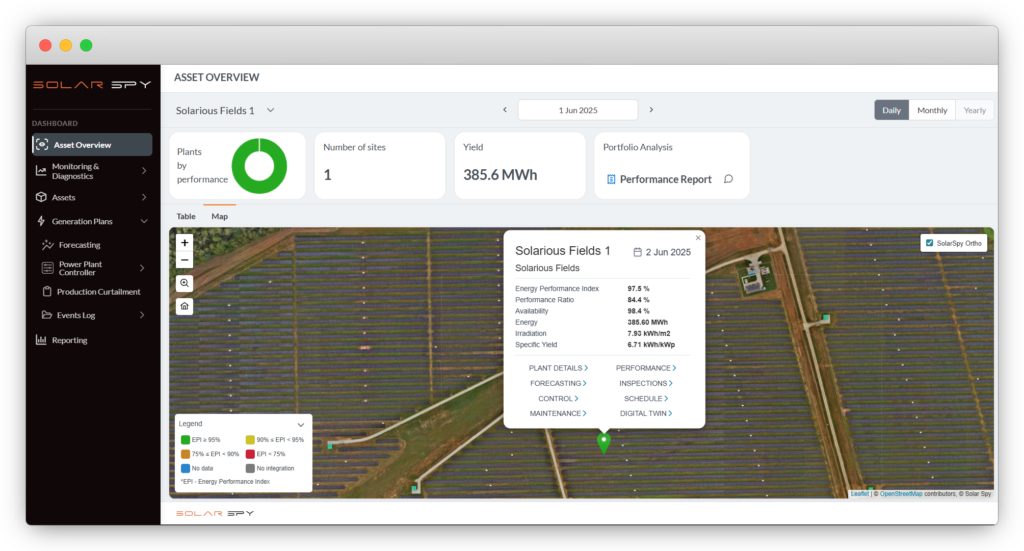
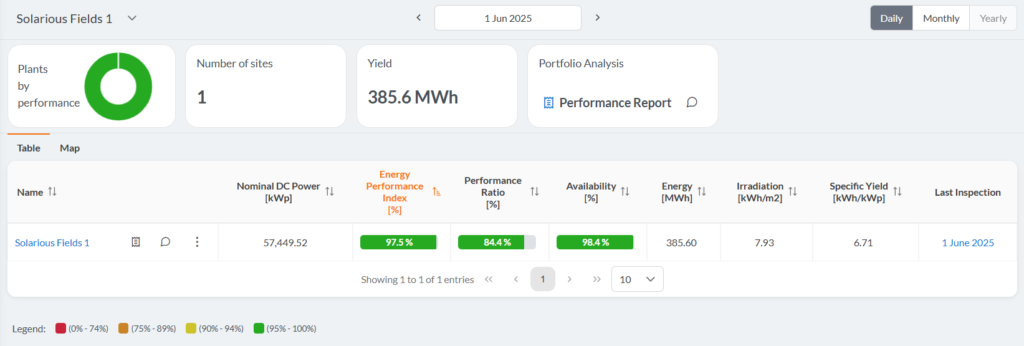
KPIs AND SOURCE DATA
Portfolio dashboard, EPI, PR, AR, events, and plant data.
DIGITAL TWIN
A plant model that connects components, relationships, and operational history.
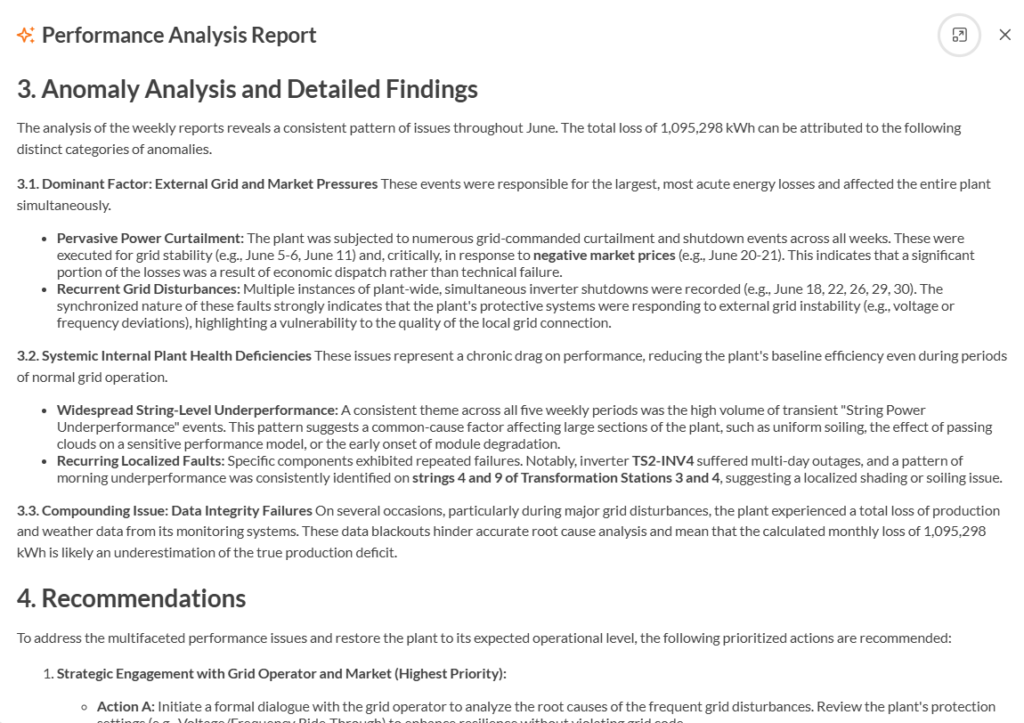
AI ANALYSIS
Assessment of root causes, performance impact, and action priorities.
OPERATIONAL DECISIONS
Insights ready to be used by technical teams and asset managers.
Three pillars of our system
Solar Spy combines performance KPIs, Digital Twin intelligence, and SolAI in one connected workspace for PV asset management.
KPIs and performance analytics
EPI, PR, AR, inverter- and string-level production analysis, and loss breakdowns help identify the source of problems faster.
Digital Twin
The Digital Twin structures technical knowledge about the PV plant. It shows relationships between components, event history, and changes in system status over time. As a result, analysis is based not only on live readings, but on full technical context.
Component and event history
Relationships between plant elements
A single source of truth for system status
Better context for diagnostics and decisions
SolAI Assistant
Your analytical assistant for PV operations. SolAI interprets platform data, answers questions, and supports operational decisions in natural language.
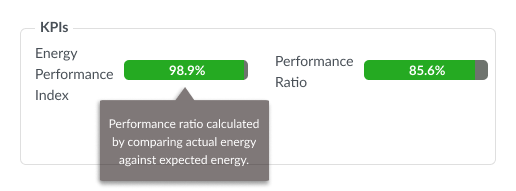
Energy Performance Index (EPI)
One number that enables a reliable assessment of plant performance and operational efficiency.
EPI evaluates PV plant health based on a physical model and real weather conditions, revealing technical losses that PR alone does not show.
Operational modules built on the same foundation
Using the same data and the same plant model, the Solar Spy Platform supports multiple areas of operational work
Reporting and event log
Reports, event logs, and consistent KPIs for teams, management, and stakeholders.
Forecasting
Production forecasts that account for weather conditions, plant operating history, and asset health.
Inspection Integration
Inspection results and AI analysis flow directly into the operational system.
Remote Power Control
Plan curtailments, manage shutdowns, and respond to market or grid signals in one workflow.
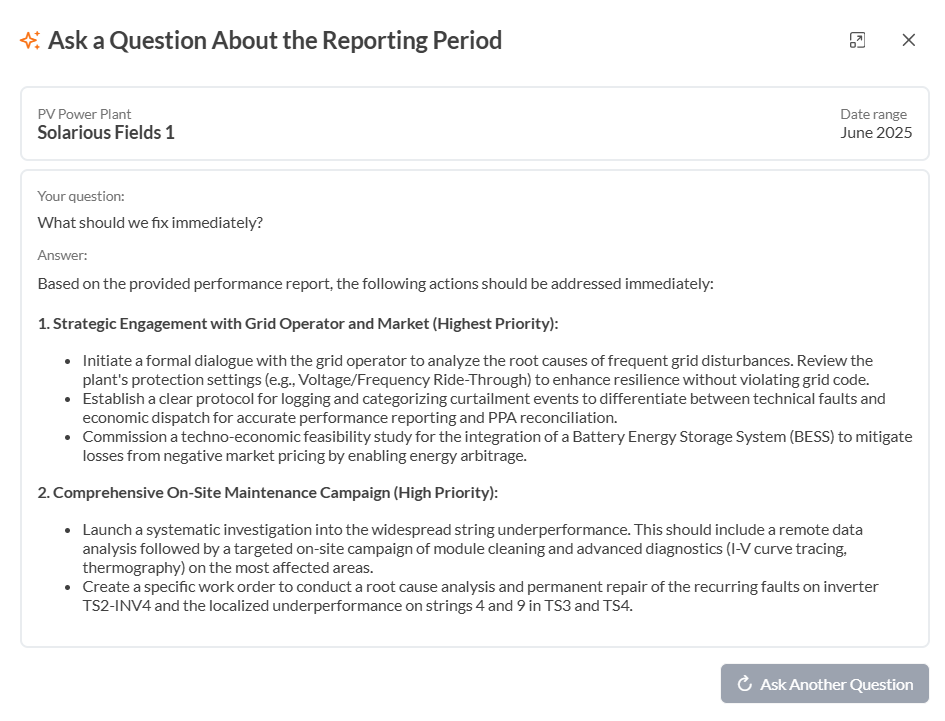
SolAI turns platform data into operational decisions
SolAI answers questions about KPIs, performance, anomalies, and operational actions.
Connects platform data with the plant’s technical context
Explains what is causing underperformance
Links anomalies to production impact and operational risk
Answers operational questions in natural language
Helps teams prioritize the right actions faster
Real business value
Better operational decisions translate into greater data transparency, faster response, and a stronger foundation for improving performance
Better identification of loss sources
Technical data and operational context help teams quickly understand what is causing the problem.
Faster response to anomalies
Issues become visible earlier, with clear context and action priorities.
Greater KPI transparency
KPIs are calculated consistently, with the ability to account for events such as curtailment or grid failures.
Stronger basis for operational decisions
Teams work from one shared view of data, not scattered reports and interpretations.