From inspection data to decisions and field action
AI detects defects, quantifies losses, and prioritizes repairs. Then, turns inspection findings into actionable O&M tasks.
Proven track record
100 MW in 2 days
That is how fast we can analyze inspection data at scale – from data delivery to final results.
1,000+ inspections
Delivered for PV plants, backed by real field experience.
4+ GWp
Total capacity of assets covered by our analyses and reports.
~5% average recovery
Of lost revenue, thanks to data-driven repair prioritization.
How does it work?
From inspection data to operational execution
Most inspections tell you what is wrong.
Solar Spy shows what to fix first, why it matters, and what your team should do next
DETECTION
AI detects and maps anomalies across the entire PV site. Thermal and RGB imagery is automatically analyzed, classified, and linked to specific components without manual review.
IMPACT ASSESSMENT
All inspection data is processed in-house and never shared with third parties. Each anomaly is quantified in terms of energy loss and financial impact, so your team can focus on what matters most.
ACTION PLAN
Turn inspection findings into field work your team can execute. Solar Spy converts insights into structured O&M tasks, accelerating response and closing the loop from detection to resolution.
Over 99% accuracy in module fault detection
What you walk away with?
Actionable results - not a pile of files
RAW INSPECTION OUTPUT
- Images and tables without a clear link to energy loss or repair priority.
- Priorities and tasks left for the team to interpret on their own.
SOLAR SPY OUTPUT
- Precise location of every detected anomaly
- IEC-compliant fault classification
- Estimated impact on energy production
- String and component map of the PV plant
SolAI turns inspection data into clear priorities and actions
The report is only the beginning. Ask SolAI what you really need to know
EXECUTIVE
VIEW
A concise summary for management and investors.
IMPACT
AND RISK ANALYSIS
Defect statistics with production impact, risk level, and priority.
RECOMMENDED
ACTIONS
Intelligent recommendations, including replacements, I-V tests, fire-risk zones, and warranty claims.
INTERACTIVE
ANALYSIS
Ask questions and get instant answers with full context: root cause, loss, risk, and recommended action.
From detected anomaly to closed service ticket
Structured tasks flow from inspection results to the mobile app and back into the Digital Twin with a full audit trail across the portfolio
- From ticket creation to field execution and closure - all in one consistent workflow
- Priorities based on fault severity, energy losses, and anomaly grouping
- Technicians receive precise location data, component history, and repair context directly in the app
- Full visibility into progress across the entire portfolio
- Offline mode keeps field work moving, with automatic data synchronization
- Every action updates the Digital Twin, keeping asset data up to date
Inspection scope tailored
to your project
Choose the right level of detail for your technical, performance, and reporting requirements
Standard Inspection
For detailed inspections adhering to top international technical standards.
- Infrared imaging at 5.5cm/px HD
- RGB imaging at ~2cm/px ITC
- Level 2 expert analysis and review
- AI prepared, human reviewed
- Anomaly classification based on normalized ΔT
See all benefits
- AI pinpoints cell & substring level anomalies
- Classification of anomalies based on the type of anomaly
- Location of anomalies – coordinates, position in the table, row and column
- Visualization of anomaly locations on a map or string plan
- Measurement of temperature difference for each anomaly
Expert Level Inspection
For detailed inspections with precise production impact analysis and expert reports adhering to top international
technical standards.
- Infrared imaging at 3cm/px
- RGB imaging at ~1cm/px
- Adheres to IEC TS 62446-3:2017 for data analysis and temperature measurement
- ITC Level 2 expert analysis and review
- AI prepared, human reviewed
- Energy loss calculation
- Anomaly classification based on normalized ΔT
See all benefits
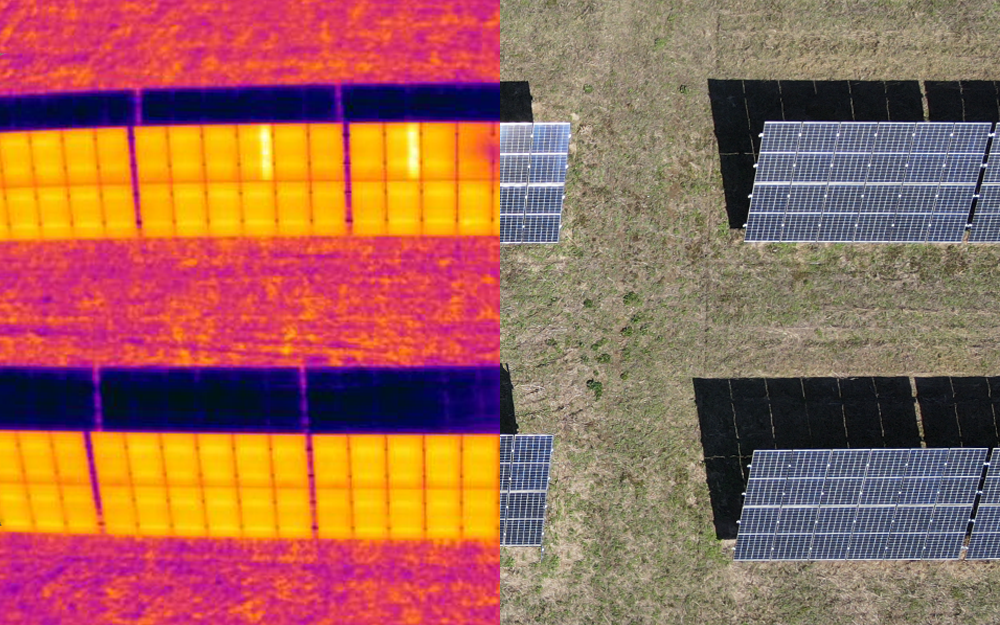
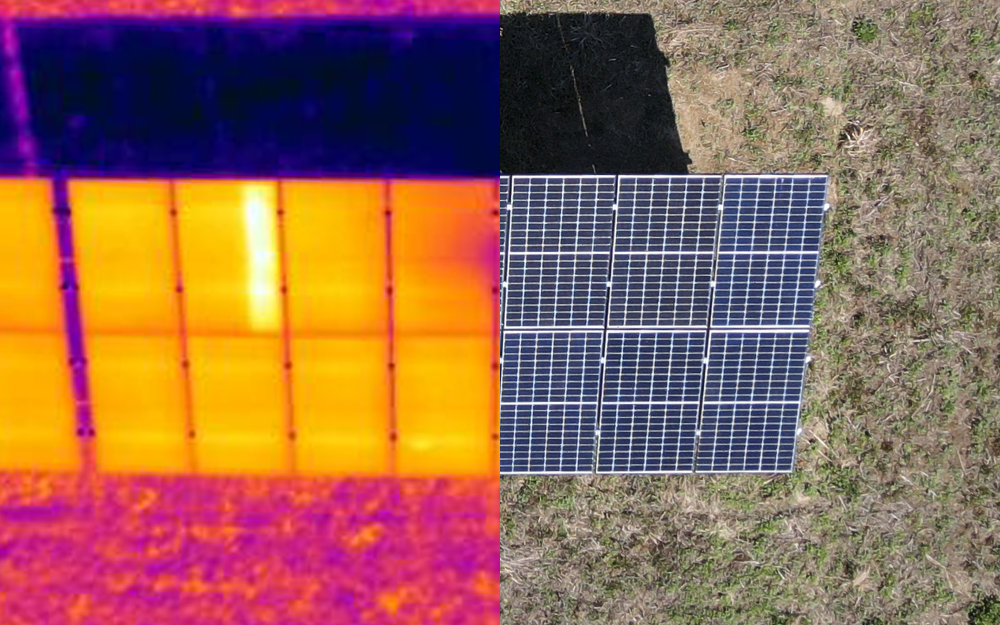
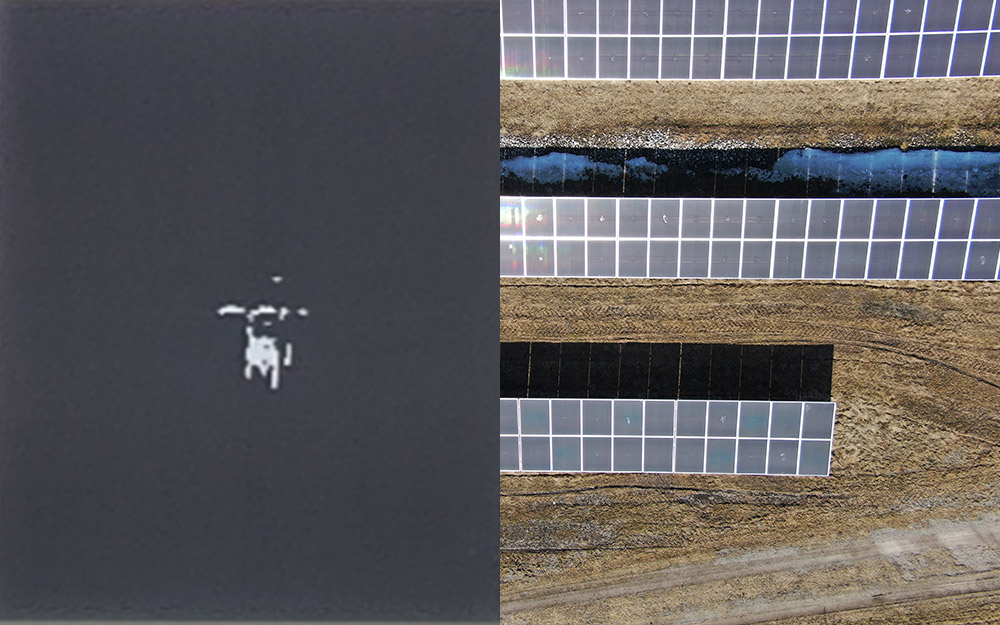
- AI pinpoints cell-level anomalies, substring issues, module defects, diode failures, junction box concerns, potential PID, shading and structural damage.
- Precise anomaly classification based on normalized delta T
- Good for insurance premium reductions
- Valid for insurance and warranty claims
- Compliant with a number of country standards for required inspections
- Ability to export data outside of Solar Spy platform in a number of formats including Excel
- In addition to the AI anomalies detection, a Solar Spy technical expert (human) site-specific recommendations
Thin-Film Delamination
Solar Spy’s unique capability to assess delamination using AI-powered RGB image analysis, quantifying and calculating the extent of delaminated cells. Most accurate on the market.
- HD RGB imaging at ~0.5cm/px
- Delamination coverage calculation
- AI prepared, human reviewed
See all benefits
- AI pinpoints cell and module level delamination calculation precise coverage
- Valid for insurance and warranty claims. Our clients have successfully recovered multiple millions from manufacturers based on these reports
- Ability to export data outside of Solar Spy platform in a number of formats including Excel
- In addition to the AI anomalies detection, a SolarSpy technical expert (human) site-specific recommendations
Proven in real PV portfolios
Trusted by asset managers and operators - from inspections to day-to-day operations.
Ergy Asset Management
193 MWp
“We received online reports that not only identified defects, but also precisely classified and located them. Integration with the orthophoto map provided clear visualization and intuitive defect location.”
Marcin Kuprel, CEO, Ergy Asset Management
ABO Energy
15 MWp
“Solar Spy’s analyses and detailed reports gave us objective, data-driven clarity. We confirmed compliance with contractual parameters and avoided contractual penalties.”