Maximizing profits from PV installations in 2023 – part 2

Part 2 of our interview with Michał Frys - Maximizing profits from PV installations in 2023 – How to increase the amount of energy produced while optimally managing operational costs.
In part one, we focused on the most common challenges for 2023 and the importance of quality data and performance analysis. Innovative and smart solutions can help us in proper budget management and in increasing the efficiency of solar farms. So, can you tell us what Solar Spy is?
Yes, it is a platform that we have been developing since 2019. It was created in response to the needs of our customers that we stated previously. However, we were not able to address all the challenges from the beginning of the project. At first, we focused on using our competences in the area of image analysis and AI to automatically detect defects on modules.
The result allowed us to offer a reliable analysis of the condition and efficiency of the farm at the actual moment of measurement. We learned to detect, locate, and characterize defects with accuracy to a single cell, and to determine how they reduce production generation. In the context of periodic, in-depth analysis of the condition of the installation, this is an extremely valuable service. Such an analysis shows the state at the time of its execution. Another challenge is the need to constantly measure the efficiency of the farm and to detect production anomalies as quickly as possible, to minimize how they impact energy generation.
That is why we have invested a lot of time and effort in developing a functionality that focuses on continuous analysis of farm performance, i.e. reliable calculation of the Energy Performance Index (EPI).
Tell us more about EPI.
The Energy Performance Index is based on the correct cyclical calculation of how much energy a photovoltaic farm should produce with given insolation conditions. We take into account its total production capacity, losses resulting from topology and specifications, and possible drops from previously diagnosed defects. This is a key indicator for supervising installation performance.
How is the Solar Spy approach different from other solutions on the market?
High-quality irradiation data, or insolation, is fundamental. To
ensure we get the highest possible data accuracy, we obtain them in
10-minute intervals from many weather models, i.e. ECMWF, GFS, ICM. We
also use historical data from the CAMS system, and if available – from
the weather station on the installation.
This approach has a
key advantage over obtaining information from just one source, or –
what is worse – not obtaining it at all. We need to remember that
station readings may be subject to error. The station may be dirty or
for various technical reasons – there might be periodic interruptions in
the supply of data from the installation. In such cases, thanks to
continuous analysis of insolation data from many sources, and continuous
analysis of energy generation, and by using efficiency data; we can
even retroactively calculate what the level of insolation was at the
time when the connection was lost. The platform was created to verify
the reliability of data to guarantee consistency and quality of the
analyses.
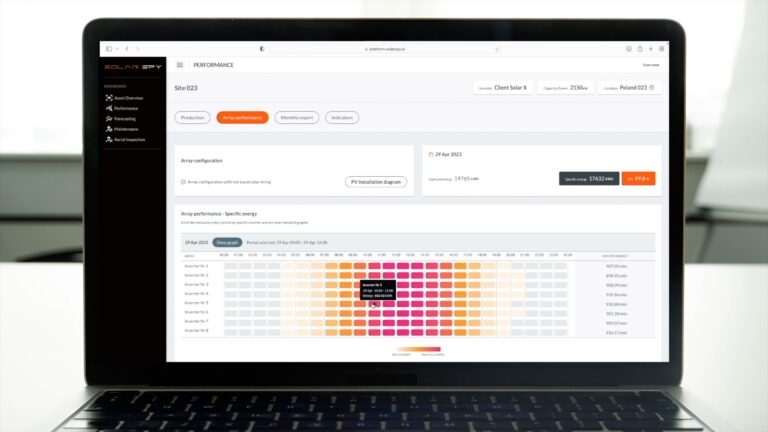
By taking into account the entire technical specification of the installation (topography, components – inverters, modules, and even the losses from connections), we calculate how much energy should be produced. We compare this result with the maximum value that the farm should produce without any defects. And this is one of the areas of our services which we call PERFORMANCE.
We are able to detect and locate significant defects at the level of a single string of the installation, such as disconnected strings, failures, reduced efficiency of the inverter, or shutting down part or the entire installation. However, we do not stop at this level of analysis.
Along with further research, we plan to implement an analysis of the characteristics of inverter performance drops. On its basis, we will be able to answer of what kind of anomaly we are dealing with. We will be able to identify whether the reason for the generation drop is, for example, dirt on the installation (all or only part of it), or whether it is, for example, the result of a bypass diode failure.
And this is where all the magic begins. Already based on such an analysis, we can see – what is the level of losses generated by the identified defects on a given string, and whether it is cost-effective to send a technician to repair it, or a service team to mow the vegetation or to wash a given part.
This is important as many plant managers are not aware of how serious dirt and soiling can be. We know from US and EU research that dirt on panels can decrease power production by 30%-40%. These values can differ in other parts of the world like the MENA region, but what we know for sure is that monitoring this, and smart scheduling of maintenance work is really crucial.
So, the Solar Spy platform will help you make the right cost-effective decisions?
Exactly. Our goal is to notify almost in real-time, based on voltage variation data – that a defect or other events have occurred on the indicated string, causing production drops.
The challenge here is automatic, intelligent diagnosis of the observed generation drops on a given string. We want to avoid the situation of getting false alarms from clouds moving over the installation.
This is a very difficult matter, but with the skillful implementation of algorithms working in the back of the Solar Spy platform, we can indicate drops that are worth noting almost immediately after they occur.
This is why Solar Spy is unique. We understand the importance of combining data from multiple sources that our clients speak of. And having a unified platform that seamlessly integrates and standardizes data from all your on-site devices, including SCADA systems, inverters, and external weather data, is crucial to gaining a comprehensive and accurate understanding of your PV portfolio’s performance. By centralizing all of your data in one place, you can gain a deeper level of analysis, that simply cannot be achieved in any other way. This means you get insights that previously were not possible, and you have this for your whole portfolio – in one platform. The truth is – many of the site monitoring devices overload operators with so much information and false alarms that the value of the output becomes very low. The answer is pushing the data into a smart platform that filters out the noise and delivers just the insights and notifications you really need to act on.
Also, the use of data science in energy generation can lead to significant cost cutting. Several studies estimate that properly applying advanced analytics should result in savings of 5% to 7.5%. Much research available online supports this, including a recent McKinsey study. This is an important value that organizations working in this field should take into consideration as they strive to improve the efficiency of their portfolios. By implementing predictive maintenance applications and optimizing operations, as well as through fine-grained performance monitoring, organizations can improve uptime and ultimately achieve such cost savings. These values are not to be underestimated and must be taken into account for achieving sustainable and profitable energy generation.
And can you identify defects with 100% certainty? Is it possible to locate anomalies within the module on which they occur, to precisely classify their types and the impact on energy production?
Here the answer is the functionality we called MAINTENANCE – this was the first phase of development of the Solar Spy platform. After analyzing the data collected with the drone, we present – in the form of a report – a detailed overview of the current state of the installation and an analysis of the level of its current performance.
How is this analysis done and why is it worth performing?
The first step is to collect the necessary data during a drone flight. By taking about 3000 RGB and thermal imaging photos of a 1MW farm, we get enough information to perform a professional analysis of the actual state of the PV installation.
The acquired photos are uploaded to our platform and processed by AI algorithms, that recognize and classify defects on each module. The result of this work is a clear and understandable report – available on our platform. For it to have business value to an investor, asset manager or O&M company, it contains three key factors.
Firstly, we show the location of the identified defects, with accuracy to a single cell on the module. The report indicates where the identified defect is, what type it is – whether it is an active bypass diode, hot spot, cracked glass, PID, and then it indicates the exact impact (calculated in kWh) on the module’s productivity and, as a result, shows the size of energy generation for the entire installation. All this, with the classification of defects, we perform in accordance with the latest European standard IECTS 62446 – 3: 2017.
I recommend here our case study, which shows how significant the drops caused by PID were at one of our clients.
Speaking of business value, why invest in such a report?
The purpose of the analysis is to present all key information regarding the current state of the installation in the form of a clear report with recommendations.
On this basis, the Investor or Asset Manager can make cost-effective decisions – whether to remove a given defect or not, and, in what order the defects should be repaired.
The AI algorithms are also able to characterize events as “safety issues”, so ones that need to be removed immediately for the safety of the installation or the technicians. These include defects such as cracked glass or a strongly heated bypass diode, which can cause a fire hazard, or worse yet, possibly electrocute the technician.
In conclusion, the investment in the analysis of the condition of the farm, supported by a reliable report, is undoubtedly worth it. The first area of return is a reliable assessment of the installation and possible threats, crucial both for its safe functioning and in performing tasks by the employees.
Moreover, along with revealing defects and estimating their impact on the production volume, we can make quick, accurate and, also, cost-effective decisions to perform significant repairs, prioritized to focus first on removing defects responsible for the largest drops in generation.
We also benefit from optimizing the work of the technician who, knowing the location and type of diagnosed defects, is able to arrange the optimal sequence of tasks and take the spare parts necessary for repairs.
Finally, such a report is a valuable document that can be used in many operational processes that have not yet been mentioned – when working with other entities.
What sort of situations do you have in mind?
For example, such a report serves as part of the acceptance protocol between the EPC company, i.e. the entity responsible for its construction, and the O&M service company, taking over the management of the installation. It is confirmation for both parties of the efficiency of the farm at the time of its transfer.
Here I recommend our case study on locating faults before buying a photovoltaic farm.
The report can also be very important from the perspective of paying compensation from the insurer. If it is necessary to liquidate the damage, e.g. after a random event such as a fire, the lack of a report that confirms the correctness of the execution and connection of the installation may expose the investor to the lack of compensation.
As a final example, I will show a completely different case of using a drone inspection report. It refers to the moment in the life of the farm when the warranty of the modules comes to an end.
The analysis contains an estimate of the reduction in module performance caused by excessive degradation. The client can use such a document when submitting a complaint to the manufacturer and try to get the modules replaced with new ones, or to obtain some other form of compensation.
A perfect example is our case study on the assessment of the degree of delamination of modules.
Thank you. Let's go back to optimizing the operational costs of maintaining the farm. Does Solar Spy offer any solutions in this area?
Yes, here we also think about the needs of our current and future customers. We wondered what next area of optimization we should take care of. The answer turned out to be the two most repeated challenges by customers. These are the coordination of all events that occur on the farm and the ease of linking them. As a result, this means summaries in the form of a periodic report, showing the impact of the operational activities carried out, with particular emphasis on the restoration of the farm’s production capacity.
Regardless of the source from which we detect a given problem related to a decrease in performance, we register events in the event log. On this basis, the O&M Manager or Plant Manager will choose what actions should be performed by technicians, thus changing the logged events into so-called tickets.
And here we move on to the next solutions of our platform – i.e. the Ticketing System, along with the mobile application.
Looking at it operationally – when the O&M Manager decides that the detected defect is significant, he creates a “ticket” for it, which automatically goes to the technician’s phone application.
But that’s not all. Bearing in mind further operational optimizations, consisting of accelerating the responses to events and minimizing the involvement of people; we plan to divide the identified events into those that I have already described, and so-called “critical events”, which can significantly reduce the farm’s efficiency.
I mean events such as the shutdown of the entire farm, or a 15-30% decrease in the generation of the entire installation. Then the platform can automatically send a notification to the technician assigned to the farm, who is on duty, and only report to the O&M Manager about such an event.
It is also a particularly important solution when we talk about problematic days like weekends or holidays. We know that many of our customers have lost significant revenues in such circumstances, due to the lack of availability of staff who could then react to sudden events.
The ticketing system and mobile application are functionalities that we plan to implement from the beginning of this year. As I mentioned, the technician will get specific information about where on the installation, and on which module the problem occurred, and a suggestion with what actions to take.
Having the procedure available in the application or the necessary instructions, he can immediately get to work. In addition, the application works even in situations of lack of connectivity, and when the technician is within the range of the network, the system automatically synchronizes.
It is important that the application will also become a tool for efficient reporting of the technician’s work. After performing the actions, he can report what he did as part of the repair by pressing one button, or by recording a note. For example: whether he managed to repair the defect or if he will need additional spare parts. The application itself will provide the most important information to the O&M Manager’s desktop, because it records the calculated times since notification, time of finding a solution, etc. This is important information that we want to analyze to see performance indicators related to the O&M team.
So, the Ticketing System with the application will give you an accurate insight into how well the installation is managed. Right?
Yes. On the basis of all events related to both the continuous analysis of the efficiency of the installation and the effectiveness of the technical teams taking care of it, we will analyze the data cross-sectionally. We will be able to go to the platform’s dashboard and see all automatic KPI and SLA performance indicators for both the O&M teams and the installation itself.
Solar Spy Ticketing System – Maintenance Management Solution
Why such an approach to analyzing these areas?
All the directions of product development chosen by us result from the needs of the market. It is from the customers that we know that on Friday at 17:10 there was a problem, the coordinator from the control center went home at 16:59, and the installation remained turned off for the whole weekend.
Returning to the discussed notification system, everyone concerned will know that a given problem has occurred. In addition, having our third Solar Spy tool FORECASTING – so, generation forecasting, we know, for example, whether the weekend will be sunny or not. Thus, we are able to determine how much generation the client will lose over the weekend – and this information will also go to the O&M Manager. On its basis, the person managing the installation will be able to make a decision: either to quickly order a technician who is to resume generation, or in the event of bad weather, he will save costs by having the restoration done on a working day. Thanks to this he will not incur additional costs of a possible repair order over the weekend.
Will the FORECASTING tool also be enriched with new functionalities?
FORECASTING is an area of the platform that we originally created to support energy trading. It can also be used for other purposes, including O&M. It is a very useful tool for planning service work and allocating time when sunlight is the lowest. Thanks to this, the loss of generation, associated with the shutdown of strings or the entire installation, is minimized. For example, when we see problems with the generation, but very cloudy weather is forecasted for tomorrow, then maybe in the case of non-working days we do not always have to react. However, in the case of planned repairs or service work, such as the replacement of the inverter, it is worth planning and implementing them at the time of the day when the weather will not be so nice, and so the loss will be smaller. The same situation applies in the case of “predictive maintenance” actions, where planned inspections or replacement of deteriorating elements should also be well planned. Thanks to the FORECASTING service, we can both plan service work and decide how fast to react to events related to performance drops.
Solar Spy Forecasting
When it comes to energy trading, the FORECASTING service can be used to forecast the size of generation from hour to hour, which in turn will minimize balancing costs. This is an area that we are developing very strongly, because we want to add satellite data to the data collected so far from many independent meteorological sources. This will allow us to make ultra-short forecasts, increasing the accuracy of forecasts to 15-minute intervals.
The third area of application of the FORECASTING service is the use of the generated data for automatic reporting to the transmission network.
Here we combine the possibility of precise forecasting of production volumes – with the automation we have created. Thus, regardless of the day of the year, non-working days or possible absences of employees, every day up to the required hour, the platform sends to the transmission network the required data related to the generation forecast for the next 10 days.
Reporting between stakeholders of a photovoltaic installation is an important, but also difficult topic. How does Solar Spy intend to assist in reporting between O&Ms and Asset Managers, and AMs and Investors?
At the beginning of the year, we plan to implement the area responsible for automatic reporting, i.e. DASHBOARDS, so that the Assset Manager or O&M Manager receives monthly information on the difference between the anticipated and actual production of a given day. Here we use the latest performance indicator, which is the EPI (Energy Performance Index) mentioned at the beginning of our conversation. Thanks to this, we have the calculated UPTIME, the time of the sun’s operation, as well as the amount of energy produced from it. The BACK LOG contains data on events that have reduced production generation, and which at the end of the month or other billing period, must be settled with the O&M.
From the O&Ms perspective, it is possible to very reliably show if the declines in generation resulted from reasons dependent or independent of their operations, and whether a given event was included in the contract or not.
For example, if it snows, the decrease in energy generation should not be counted as part of the O&M contract’s guaranteed performance maintenance rate. But if, despite what is stated in the SLA, there was no response to such an event within 12 hours and, for example, the action was taken only after 48 hours or more, you can detect such a problem, calculate the associated costs of losing production and answer the question – what can be done in the future to prevent this from happening again.
Anything you would like to add for our closing words?
To sum
up, in the current situation of change and with the growing costs of
maintaining photovoltaic farms, it is crucial to focus on the area of
maximizing production efficiency and optimizing the operating costs of
PV farms.
Solar Spy solutions allow you to analyze how your
plant is operating in an affordable and cost-effective way, detect
production drops, and provide reliable data on the condition and
possible defects – quickly, consistently and reliably. In addition, the
use of artificial intelligence algorithms (AL and ML technologies) in
the platform helps in even better asset management and in making
cost-effective decisions thanks to smart recommendations.
The Solar Spy platform can be implemented for both large and small photovoltaic installations. This is an excellent solution for 2023, which we are still developing to help produce even more green energy and reduce our customers’ production losses to an absolute minimum.